I’m working on a project that houses a bunch of Raspberry Pi computers in multiple remote locations. I wanted to be able to monitor the “Health” of the hardware in these remote locations. The metrics I was hoping to capture are Up-time, CPU temps, CPU usage, Memory and disk usage, etc.. as you may have noticed, I also have a love/hate relationship with Grafana, which made it the only choice for displaying these metrics in a user-friendly way.
Prerequisites:
1 x VM running Ubuntu 20.04 – I tested using a Cloud Compute server on VULTR, but you could use any VM that is on the same network as the RPi.
1 x RPi – As long as the RPi is on the same network it will be good to go. I tested over a VPN and it worked also.
Software Stack:
Influxdb – As usual the time series database.
Grafana – My favorite program for displaying this kind of data.
Telegraf – A plugin server agent for collecting and passing hardware metrics such as CPU, Temps, RAM, Storage, etc…
Install InfluxDb on VM/Host
Install Grafana on VM/Host
Install Telegraf on Raspberry Pi (RPi)
Configuration – Telegraf on RPi
Telegraf.conf
Configuration – InfluxDB on VM/Host
Configuration – Grafana
Navigate to your Grafana Install: http://<server-ip-address>:3000
Login: default login is admin:admin
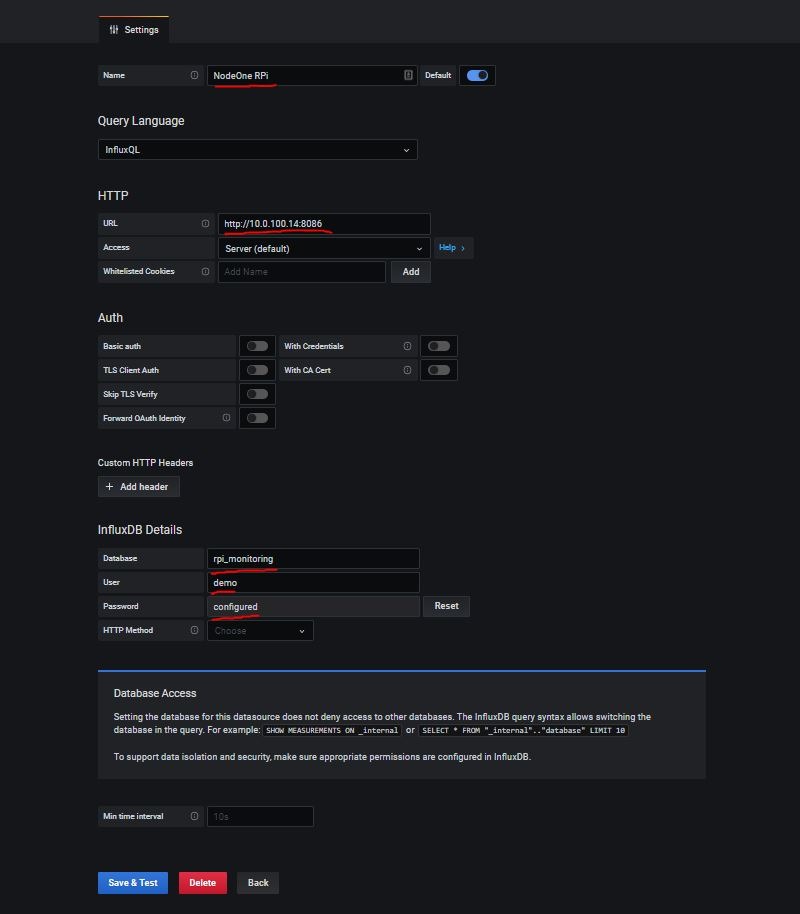
The first step is to add the Influxdb data source:
The second step is to import the Dashboard – We used this dashboard from the Grafana Library:
https://grafana.com/grafana/dashboards/10578/reviews Props to Jorge
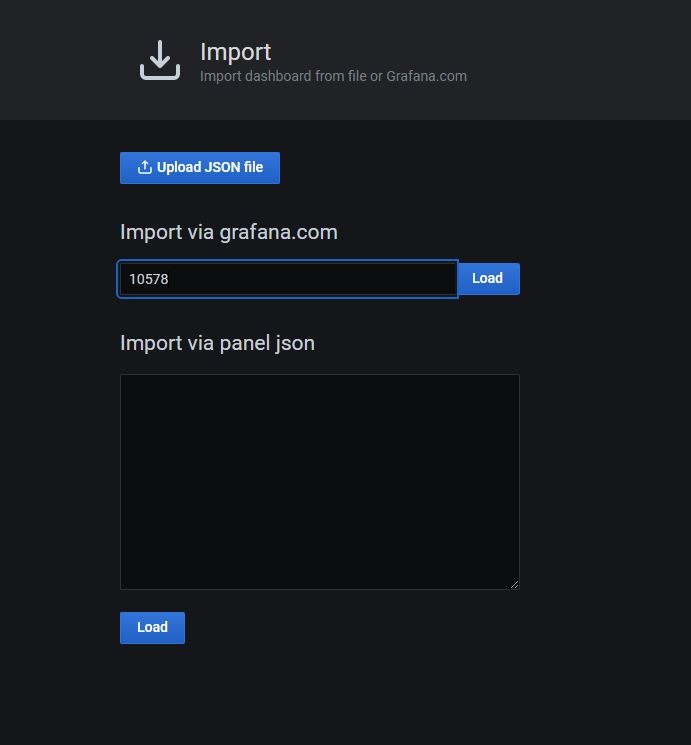
To import the dashboard, navigate to DASHBOARD > MANAGE > IMPORT
Insert 10578 into the field and click ‘Load’
Make sure you then select the datasource to associate with the dashboard.
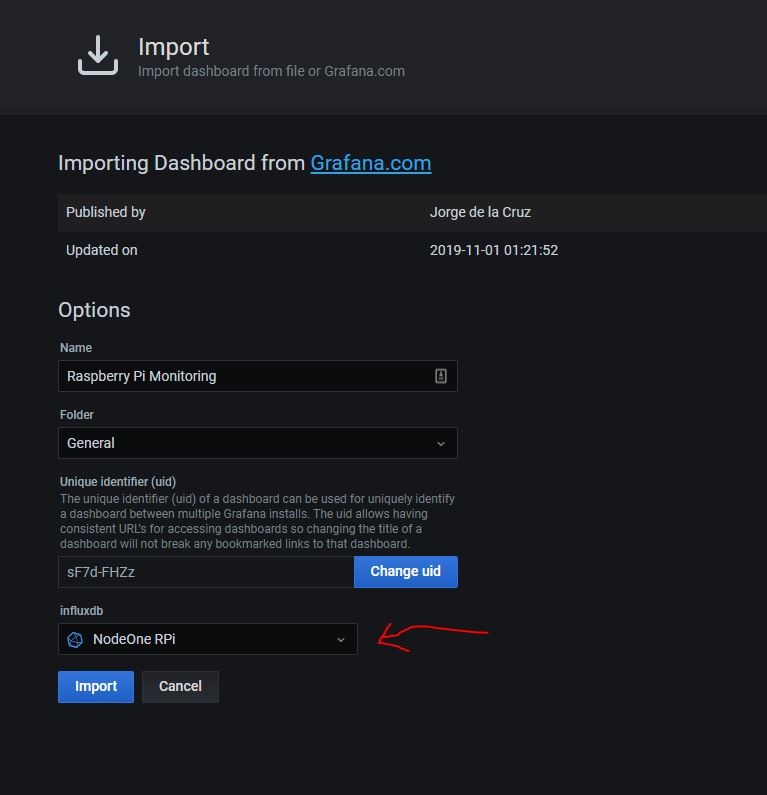
You should now be greeted with a Dashboard that is connected to the RPi.
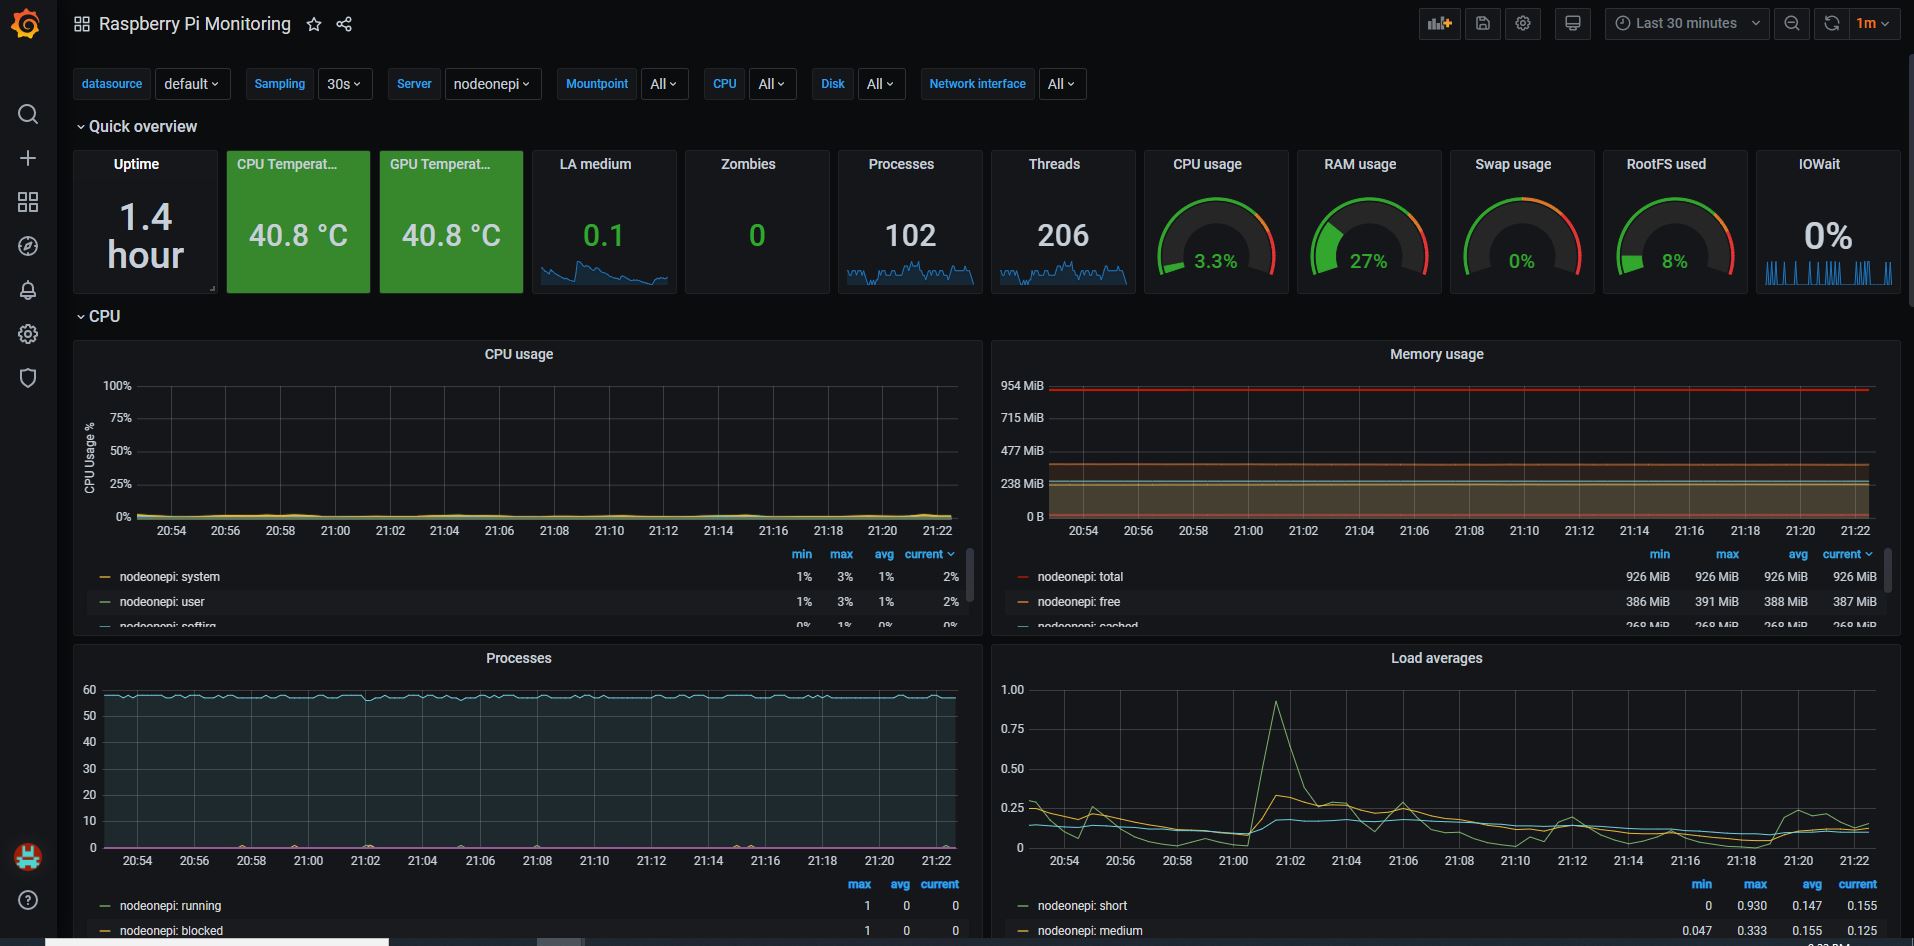
The rest is now up to you! Add multiple RPi’s. You can switch between them at the top of the Dashboard.
A big thanks to Dorian Machado and his article. Also Jorge de la Cruz and his Dashboard! These guys did the real heavy lifting.